
RRRC ROMS
Great Barrier Reef Ocean Modelling

Great Barrier Reef Ocean Modelling
To simulate physical ocean properties across the broader GBR region with high realism, we have established the GBR Ocean Digital Twin System based on the Regional Ocean Modeling System (ROMS). ROMS is a state-of-the-art, three-dimensional ocean model widely adopted by the global oceanographic community for its robustness and versatility. More information is available at https://www.myroms.org.
The numerical grid for our GBR model was carefully constructed using high-resolution (30 m) bathymetric data, interpolated onto a 1 km model grid. Minimal smoothing was applied during this process to preserve key bathymetric features such as coral reefs and complex seabed structures (see Figure 1).
Atmospheric forcing at the ocean surface is derived from the NCEP atmospheric model, which provides hourly 13 km resolution data. This includes all necessary variables to accurately represent surface fluxes of heat, momentum, and freshwater—specifically, air temperature, humidity, wind, precipitation, shortwave and longwave radiation, and mean sea level pressure.
Open boundary conditions are supplied by the global NEMO ocean model, a well-established, data-assimilative system from Marine Copernicus. This ensures realistic external influences on the GBR domain. In addition, spectral tidal forcing for the nine major tidal constituents is applied along open boundaries to capture tidal dynamics accurately.
Recognising the significant impact of riverine input on coastal ocean dynamics, we have incorporated all major rivers into the model. Hourly freshwater flux data were used in all simulations to accurately represent river discharge, which is a critical driver of nearshore processes. As an example, during February 2025, the GBR had a major flooding event directly impacting coastal surface salinity (Figure 2) with significant ecological consequences. Fresh water is significantly lighter than open ocean salty water masses and it is mostly spreading in the surface layers. However, this event was so strong along with strong atmosphere forcing and ocean vertical mixing it reached even bottom boundary layers (Figure 3) directly affecting biota.
The entire modelling system has been running in near real-time since the beginning of 2025, producing daily forecasts of the 3D ocean state. Model outputs are archived and made publicly accessible via a modern THREDDS server using the openDAP protocol.
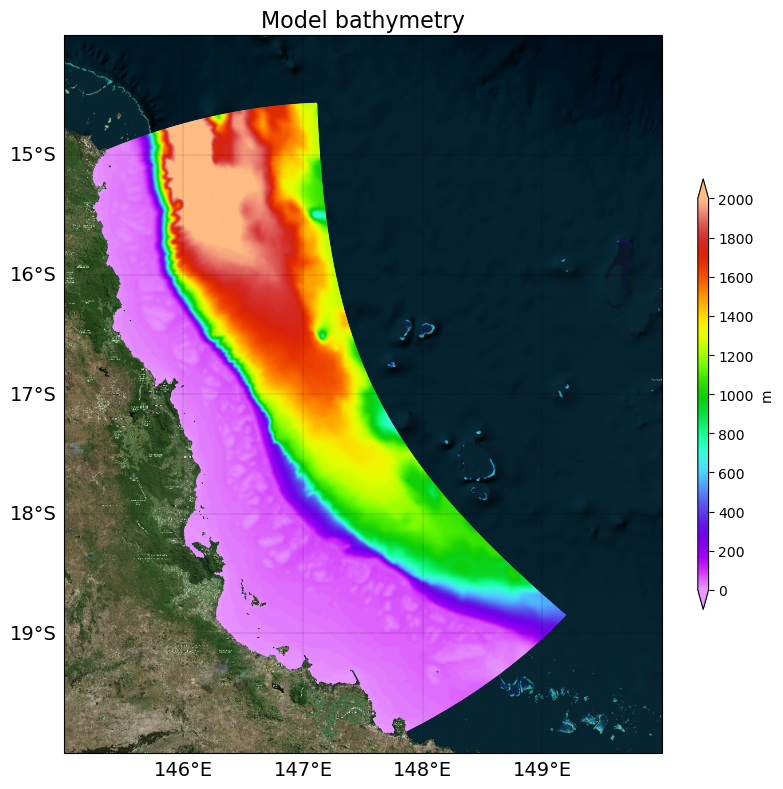
Figure 1: GBR 1 km ROMS model bathymetry.
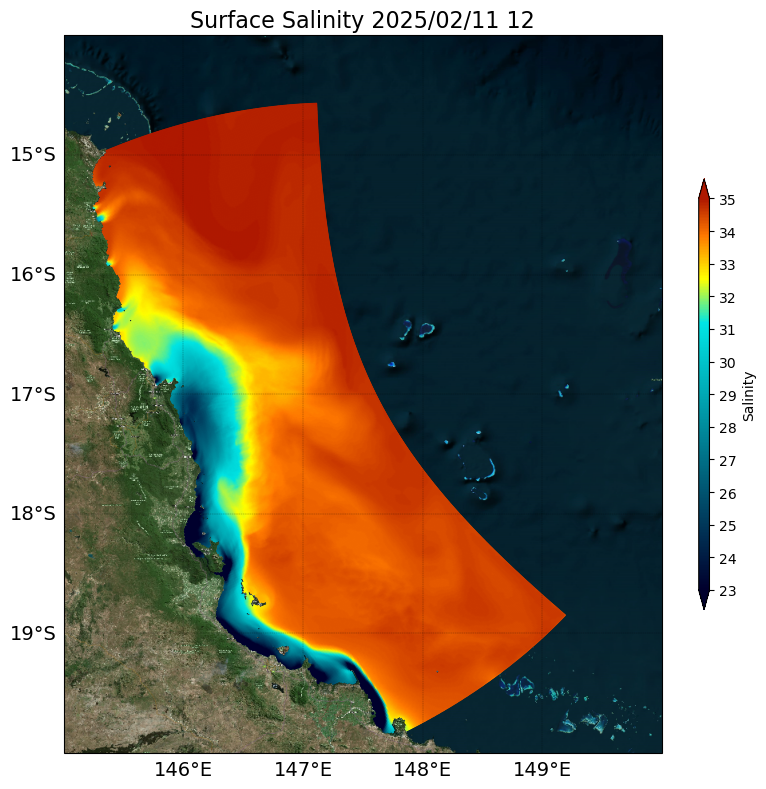
Figure 2: Daily mean of surface layer salinity during strong rivers flow.
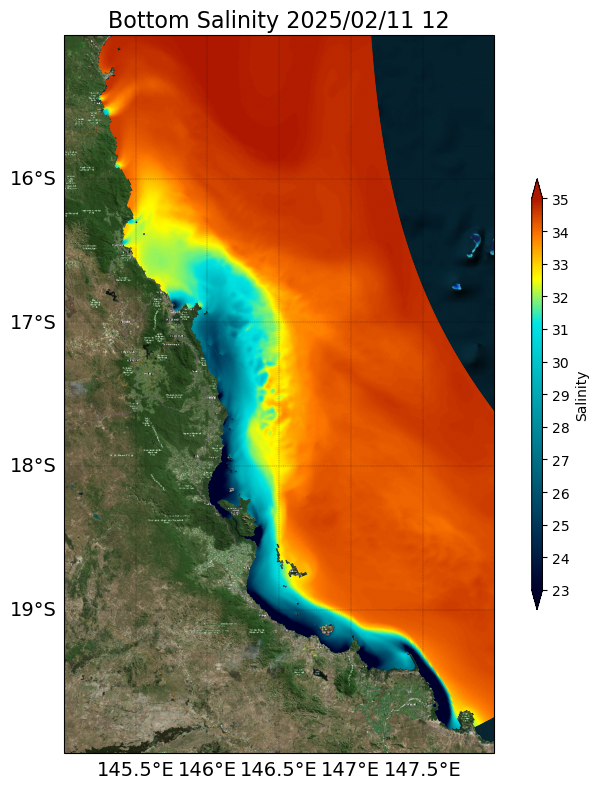
Figure 3: Daily mean bottom layer salinity during strong rivers flow.